Grafana Loki for Homelab Centralized Logging
Set up centralized logging in your homelab with Grafana Loki, Promtail, and Docker Compose. Cost-effective log aggregation that scales with your infrastructure.
Table of Contents
- Why Loki for Homelabs?
- The Stack: PLG (Promtail, Loki, Grafana)
- Docker Compose: The Quick Start
- Loki Configuration: Minimal but Functional
- Promtail Configuration: Gathering Logs
- LogQL: Querying Your Logs
- Basic Log Stream Selection
- Line Filtering
- Time Range Queries
- JSON Log Parsing
- Metric Queries
- Grafana Integration: Dashboards and Explore
- Using Explore
- Creating Dashboards
- Best Practices for Homelab Deployments
- Label Strategy
- Storage Considerations
- Security Hardening
- Alerting on Logs
- Scaling Up: From Homelab to Production
- Object Storage Backend
- High Availability
- Replace Promtail with Grafana Alloy
- Troubleshooting Common Issues
- No Logs Appearing
- High Memory Usage
- Query Timeouts
- Conclusion: Is Loki Right for Your Homelab?
- Quick Reference
If you’ve ever found yourself SSH-ing into five different servers to check logs after something breaks, you understand the pain of decentralized logging. You’re not alone—log sprawl is one of the most common homelab growing pains.
Grafana Loki offers a solution that’s both powerful and practical for home infrastructure. Unlike traditional log aggregators that index every word, Loki indexes only metadata (labels). This approach dramatically reduces storage requirements and operational complexity, making it perfect for homelab-scale deployments.
Let’s build a complete centralized logging stack that fits on a single machine and scales as your infrastructure grows.
Why Loki for Homelabs?
Traditional logging solutions like Elasticsearch are resource hogs. They index the full content of every log line, consuming CPU, RAM, and storage at alarming rates. For a homelab with a dozen containers and a handful of services, that’s overkill.
Loki’s approach is different:
| Feature | Traditional (Elasticsearch) | Loki Approach |
|---|---|---|
| Indexing | Full-text indexing | Label-only indexing |
| Storage | High (10GB+/day common) | Low (1-2GB/day typical) |
| RAM | 4GB+ recommended | <1GB for homelab scale |
| Query | Lucene/DSL | LogQL (PromQL-inspired) |
| Cost | Enterprise pricing | Free, open-source |
The tradeoff? Loki can’t do free-text search as fast as Elasticsearch. But for homelab workloads—troubleshooting specific services, tracking errors, monitoring patterns—label-based queries are exactly what you need.
The Stack: PLG (Promtail, Loki, Grafana)
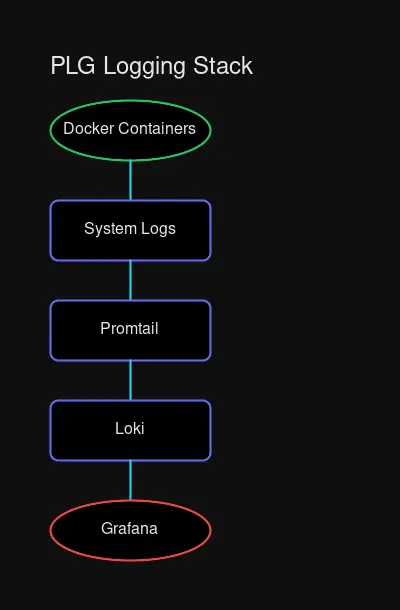
The PLG stack mirrors the classic Prometheus + Grafana combination you’re probably already using for metrics:
- Promtail — Log collector agent that discovers, labels, and ships logs to Loki
- Loki — Log aggregation server that stores and queries your logs
- Grafana — Visualization layer that provides dashboards and the Explore interface
Promtail runs on each host, scrape logs, applies labels, and pushes them to Loki. You run one Loki instance (or cluster) that receives logs from all your Promtail agents. Grafana connects to Loki as a datasource and provides the interface for querying and visualizing logs.
Docker Compose: The Quick Start
For most homelabs, a Docker Compose deployment is the simplest path to get started. Here’s a production-ready configuration:
# docker-compose.yaml
version: "3.8"

services:
  loki:
    image: grafana/loki:3.3
    container_name: loki
    ports:
      - "3100:3100"
    volumes:
      - ./loki-config.yaml:/etc/loki/config.yaml:ro
      - loki-data:/loki
    command: -config.file=/etc/loki/config.yaml
    restart: unless-stopped
    networks:
      - monitoring

  promtail:
    image: grafana/promtail:3.3
    container_name: promtail
    volumes:
      - ./promtail-config.yaml:/etc/promtail/config.yaml:ro
      - /var/log:/var/log:ro
      - /var/lib/docker/containers:/var/lib/docker/containers:ro
      - /var/run/docker.sock:/var/run/docker.sock:ro
    command: -config.file=/etc/promtail/config.yaml
    restart: unless-stopped
    networks:
      - monitoring
    depends_on:
      - loki

  grafana:
    image: grafana/grafana:11
    container_name: grafana
    ports:
      - "3000:3000"
    volumes:
      - grafana-data:/var/lib/grafana
    environment:
      - GF_SECURITY_ADMIN_USER=admin
      - GF_SECURITY_ADMIN_PASSWORD=${GRAFANA_PASSWORD:-admin}
    restart: unless-stopped
    networks:
      - monitoring
    depends_on:
      - loki

networks:
  monitoring:
    driver: bridge

volumes:
  loki-data:
  grafana-data:
This compose file sets up all three services on a dedicated monitoring network with persistent storage for both Loki and Grafana data.
Loki Configuration: Minimal but Functional
Create loki-config.yaml in the same directory:
# loki-config.yaml
auth_enabled: false

server:
  http_listen_port: 3100
  grpc_listen_port: 9096

common:
  instance_addr: 127.0.0.1
  path_prefix: /loki
  storage:
    filesystem:
      chunks_directory: /loki/chunks
      rules_directory: /loki/rules
  replication_factor: 1
  ring:
    kvstore:
      store: inmemory

schema_config:
  configs:
    - from: 2020-10-24
      store: tsdb
      object_store: filesystem
      schema: v13
      index:
        prefix: loki_index_
        period: 24h

limits_config:
  reject_old_samples: true
  reject_old_samples_max_age: 168h
  retention_period: 744h  # 31 days

compactor:
  working_directory: /loki/compactor
  shared_store: filesystem
  compaction_interval: 10m
  retention_enabled: true
  retention_delete_delay: 2h
Key choices here:
- Single binary mode — All components run in one process (perfect for homelab)
- Filesystem storage — Uses local disk; swap to Minio/S3 for larger setups
- TSDB schema (v13) — Latest recommended schema with better performance
- 31-day retention — Adjust based on your storage constraints
Promtail Configuration: Gathering Logs
Promtail needs to know where to find logs and how to label them. Here’s a configuration that handles both system logs and Docker container logs:
# promtail-config.yaml
server:
  http_listen_port: 9080
  grpc_listen_port: 0

positions:
  filename: /tmp/positions.yaml

clients:
  - url: http://loki:3100/loki/api/v1/push

scrape_configs:
  # System logs from /var/log
  - job_name: system
    static_configs:
      - targets:
          - localhost
        labels:
          job: varlogs
          host: ${HOSTNAME}
          __path__: /var/log/*log

  # Docker container logs with auto-discovery
  - job_name: docker
    docker_sd_configs:
      - host: unix:///var/run/docker.sock
        refresh_interval: 5s
    relabel_configs:
      - source_labels: [__meta_docker_container_name]
        regex: "/(.*)"
        target_label: container
      - source_labels: [__meta_docker_container_label_com_docker_compose_service]
        target_label: compose_service
      - source_labels: [__meta_docker_container_log_stream]
        target_label: stream
The Docker service discovery (docker_sd_configs) is where the magic happens. Promtail automatically discovers all running containers and extracts labels from Docker metadata. The relabel_configs transform Docker labels into Loki labels you can query.
LogQL: Querying Your Logs
LogQL is Loki’s query language, inspired by PromQL. If you’ve written Prometheus queries, LogQL will feel familiar.
Basic Log Stream Selection
# All logs from a specific job
{job="varlogs"}

# All logs from a Docker container
{container="nginx"}

# Multiple label filters (AND logic)
{compose_service="postgres", stream="stderr"}
Line Filtering
# Logs containing "error" (case-sensitive)
{job="varlogs"} |= "error"

# Logs matching a regex pattern
{container="nginx"} |~ "failed (authentication|connection)"

# Exclude debug logs
{container="api"} != "debug"
Time Range Queries
# Last hour of errors
{container="app"} |= "error" [1h]

# Specific time window
{job="syslog"} [5m] offset 2h
JSON Log Parsing
If your applications output JSON logs (recommended!), LogQL can parse them:
# Parse JSON and filter by field
{job="app"} | json | level="error"

# Extract and display specific fields
{job="app"} | json | line_format "{{.timestamp}} [{{.level}}] {{.message}}"
Metric Queries
LogQL can derive metrics from logs, perfect for dashboards and alerts:
# Rate of error logs per container
sum by(container) (rate({container=~".+"} |= "error" [5m]))

# Count of HTTP 500 errors over time
sum by(status) (
  count_over_time(
    {job="nginx"} | json | status=~"5.."
  [1h]
  )
)

# Top 10 containers by log volume
topk(10, sum by(container) (rate({container=~".+"} [5m])))
Grafana Integration: Dashboards and Explore
After deploying the stack, connect Grafana to Loki:
- Navigate to Configuration → Data Sources
- Click Add data source
- Select Loki
- Set URL to
http://loki:3100 - Click Save & Test
Using Explore
The Explore view is your primary interface for log queries:
- Open Explore from the main menu
- Select your Loki datasource
- Use the label browser to select logs (e.g.,
container="nginx") - Add filters with the query editor
- Toggle between Logs view (raw) and Graph (metrics)
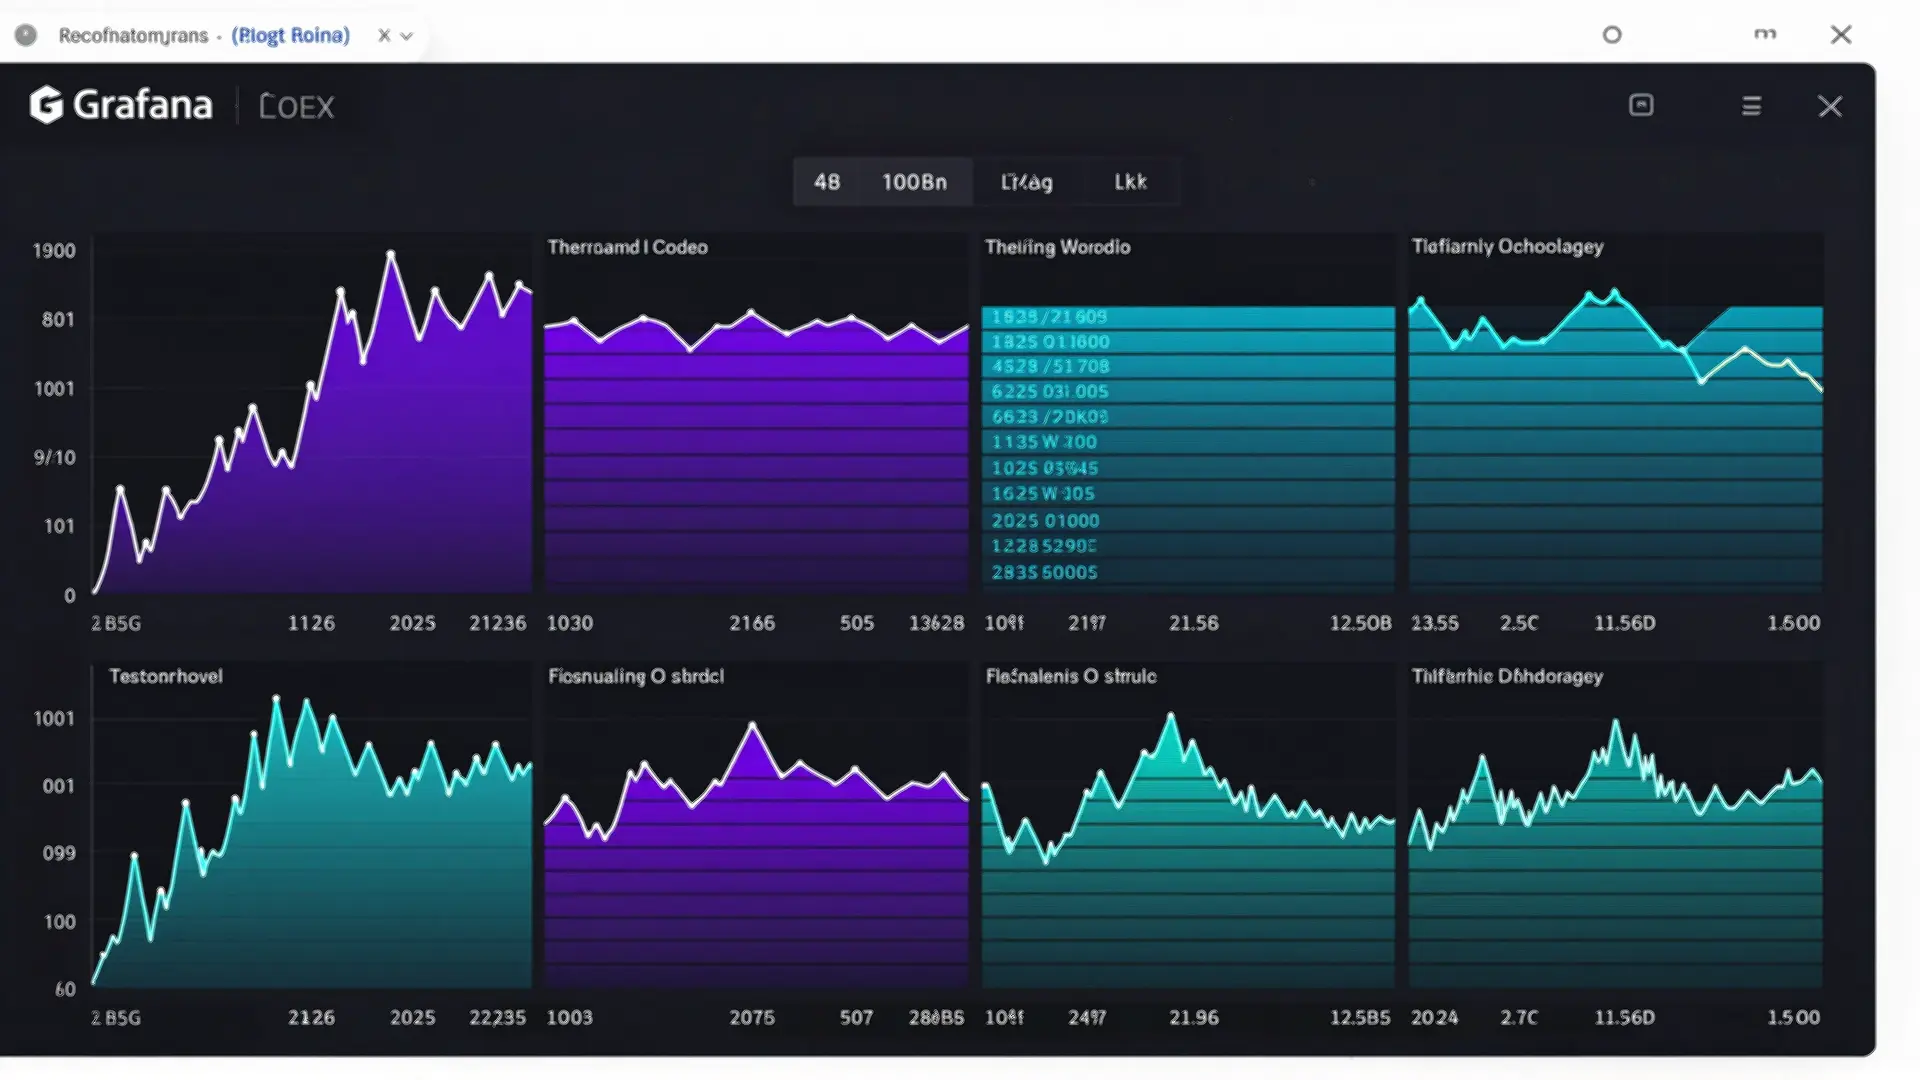
Creating Dashboards
Build dashboards that combine metrics and logs:
Panel 1: Log Volume Over Time
sum(rate({container=~".+"}[5m]))Panel 2: Error Rate by Container
sum by(container) (rate({container=~".+"} |= "error"[5m]))Panel 3: Top Containers by Size
topk(5, sum by(container) (bytes_over_time({container=~".+"}[1h])))Best Practices for Homelab Deployments
Label Strategy
Labels are Loki’s primary indexing mechanism. Use them wisely:
Good labels (low cardinality):
job— Service identifiercontainer— Container namehost— Machine hostnameenvironment— dev/staging/prodlevel— log level (info/warn/error)
Avoid (high cardinality):
user_id— Potentially millions of valuesrequest_id— Unique per requesttimestamp— Already indexed by time
High-cardinality labels explode Loki’s index and destroy performance. When in doubt, put variable data in the log content, not in labels.
Storage Considerations
For homelab scale, local filesystem storage is sufficient:
# Approximate storage needs (varies by log volume)
# Light homelab (~10 containers): 500MB-1GB/day
# Medium homelab (~50 containers): 2-4GB/day
# Heavy homelab (~100+ containers): 5-10GB/day
For larger deployments or multi-host setups:
- Deploy Minio for S3-compatible object storage
- Configure Loki to use the S3 backend
- Set up retention policies (30-90 days typical)
Security Hardening
Loki has no built-in authentication. For homelabs:
Option 1: Network Isolation
# Keep Loki on internal network only
networks:
  monitoring:
    internal: true  # No external access
Option 2: Reverse Proxy with Auth
# Put Nginx with basic auth in front of Loki
services:
  loki-proxy:
    image: nginx:alpine
    ports:
      - "3100:80"
    volumes:
      - ./nginx.conf:/etc/nginx/nginx.conf:ro
      - ./htpasswd:/etc/nginx/htpasswd:ro
Alerting on Logs
Create alerts in Grafana based on log patterns:
Alert 1: High Error Rate
# Alert when error rate exceeds threshold
condition: WHEN sum(rate({container="app"} |= "error"[5m])) > 10
evaluate: every 1m
for: 5m
Alert 2: Service Down
# Alert when no logs received from a container
condition: WHEN count_over_time({container="critical-service"}[5m]) == 0
evaluate: every 1m
for: 2m
Scaling Up: From Homelab to Production
When your homelab grows or you’re ready for production best practices:
Object Storage Backend
Replace filesystem storage with Minio or S3:
# loki-config.yaml
common:
  storage:
    s3:
      endpoint: minio.internal:9000
      region: us-east-1
      bucket_name: loki-logs
      access_key_id: ${MINIO_ACCESS_KEY}
      secret_access_key: ${MINIO_SECRET_KEY}
High Availability
For critical infrastructure:
- Deploy 3 Loki instances with
-target=readand-target=write - Use memberlist ring for coordination
- Run multiple Promtail instances (one per host)
- Add load balancer in front of Loki read path
Replace Promtail with Grafana Alloy
Grafana Alloy is the successor to Promtail with additional features:
# Replace promtail service in compose
alloy:
  image: grafana/alloy:latest
  volumes:
    - ./alloy-config.yaml:/etc/alloy/config.yaml:ro
    - /var/log:/var/log:ro
    - /var/lib/docker/containers:/var/lib/docker/containers:ro
  command:
    - run
    - /etc/alloy/config.yaml
    - --server.http.listen-addr=0.0.0.0:12345
Troubleshooting Common Issues
No Logs Appearing
- Check Promtail connectivity:
curl http://promtail:9080/metrics - Verify Loki is receiving:
curl http://loki:3100/ready - Check labels in Grafana Explore
High Memory Usage
Loki uses memory for caching and compaction. For homelabs:
limits_config:
  max_query_length: 721h  # Limit query time range
  max_entries_limit_per_query: 5000
  per_stream_rate_limit: 5MB
Query Timeouts
Large time ranges with many logs may timeout:
# Instead of querying 30 days
{container="nginx"} [30d]

# Query in chunks or use metric queries
sum(rate({container="nginx"}[30d]))
Conclusion: Is Loki Right for Your Homelab?
Choose Loki if:
- You want centralized logging without enterprise overhead
- You’re already using Grafana for dashboards
- You have limited RAM/storage resources
- You prioritize simplicity and cost
Consider alternatives if:
- You need free-text search on log content (use Elasticsearch/Loki + Elastic)
- You have massive log volumes (>100GB/day)
- You require enterprise support (use Grafana Cloud)
For most homelabbers, Loki hits the sweet spot: enough power to debug complex issues, light enough to run on modest hardware, and free enough to fit any budget.
Quick Reference
| Component | Port | Purpose |
|---|---|---|
| Loki | 3100 | Log aggregation API |
| Promtail | 9080 | Metrics endpoint |
| Grafana | 3000 | Web UI |
Essential LogQL queries:
# Errors across all containers
{container=~".+"} |= "error"

# Rate of logs per container
sum by(container) (rate({container=~".+"}[5m]))

# Parse JSON logs
{job="app"} | json | level="error"
Start here: docker compose up -d → Open Grafana → Add Loki datasource → Explore your logs.
Welcome to centralized logging. Your troubleshooting sessions just got a lot shorter.

Comments
Powered by GitHub Discussions