What's New in the AgentOS Dashboard: Content Management, Kanban Tasks, and More
The AgentOS Dashboard gets a major update: Content tab for publishing workflow, Kanban task management, API proxy system, and enhanced agent cards with glassmorphism design.
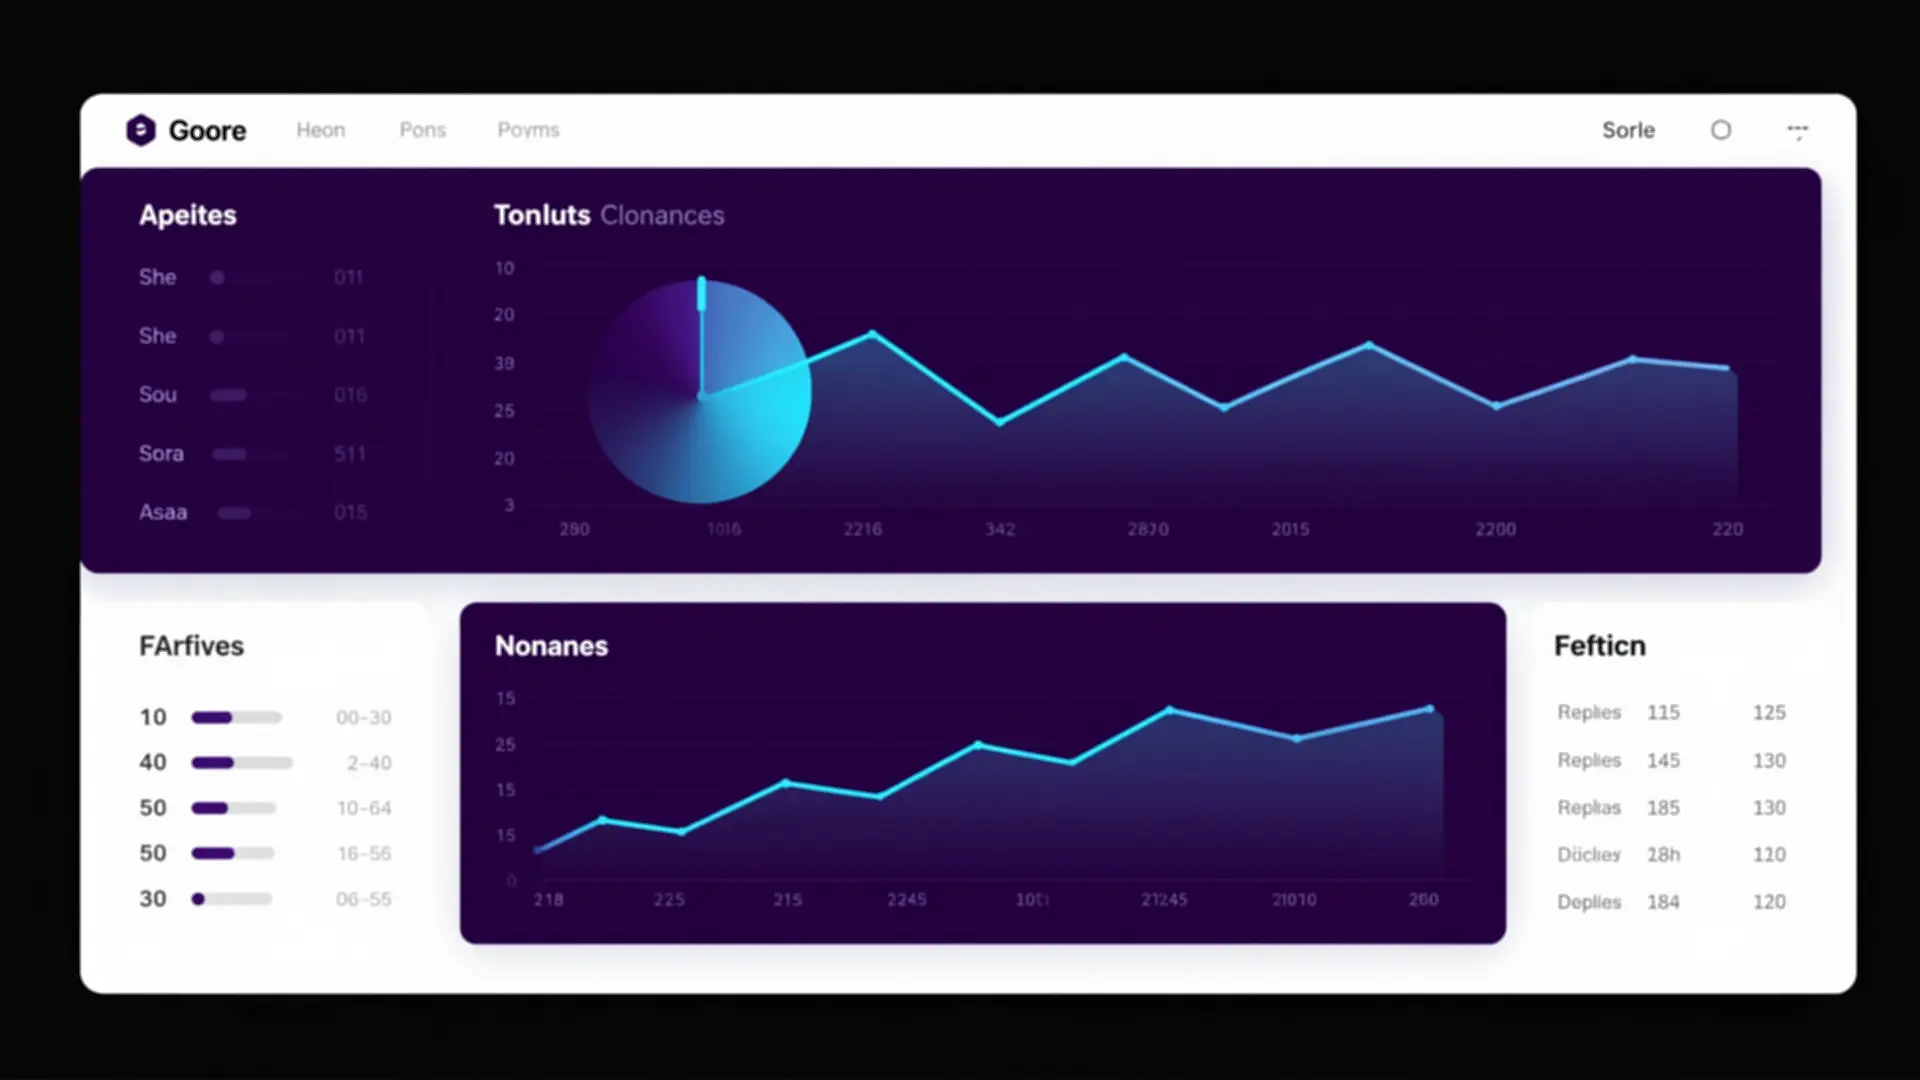
Table of Contents
- Architecture Overview
- The Content Tab
- Three Panels, One View
- The CORS Problem (And How We Solved It)
- Kanban Task Management
- Three Columns
- Rich Task Cards
- Drag. Drop. Done.
- Productivity Dashboard
- Enhanced Agent Cards
- Glow Borders
- More Than Just Stats
- Model Usage Tracking
- Design: Glassmorphism Done Right
- Still Zero Build
- The Numbers
- What’s Next
The AgentOS Dashboard launched with activity logging and agent monitoring. But a dashboard is only useful if it actually helps you get work done. After a few weeks of using it, the gaps became obvious: I couldn’t see my content pipeline, I couldn’t manage tasks, and I had no way to track what articles were in progress.
This update fixes all of that. Let me show you what’s new.
Architecture Overview
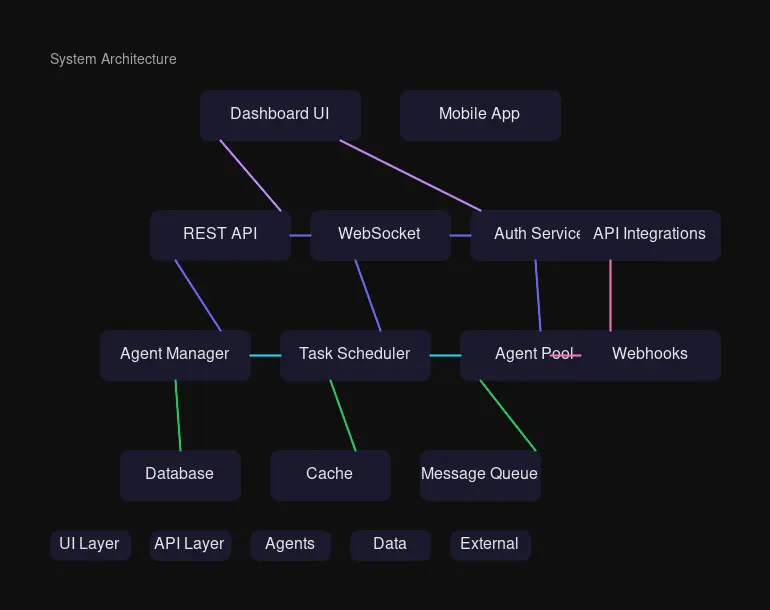
The dashboard architecture remains simple: a single HTML frontend talks to Qdrant through a Python proxy server. New API endpoints were added to handle CORS issues and enable communication with external services like antlatt.com.
The Content Tab
The biggest addition is a dedicated Content tab that gives you a complete view of your publishing workflow.
Three Panels, One View
Published Articles shows everything live on your site:
- Fetched from antlatt.com via local API proxy
- Searchable by title and tags
- Sorted by date, showing the 12 most recent
Drafts in Progress tracks articles still in the pipeline:
- Connected to a Qdrant
draftscollection - Shows status badges: Draft (blue) or Published (green)
- Displays completion indicators: 📝 article written, 🔍 research done, 🖼️ images ready
Recent Content Activity filters the main activity feed:
- Shows only article-related, content, blog, and deploy tasks
- Helps you see who’s working on what content
- Color-coded by agent for quick scanning
The CORS Problem (And How We Solved It)
Here’s the thing: the dashboard runs on port 45680. Qdrant lives at your-qdrant-server:6333. Browsers block cross-origin requests by default. And antlatt.com? It returns 403 Forbidden to direct browser requests.
The solution: a Python API proxy.
# /api/articles → fetches antlatt.com with proper headers
# /api/drafts → queries Qdrant drafts collection
# /api/qdrant/* → proxies all Qdrant requests
Every request goes through server.py, which adds authentication and handles the proxying. The browser only talks to localhost:45680. Clean, secure, and it works.
Kanban Task Management
The Tasks tab is now a full Kanban board with drag-and-drop functionality.
Three Columns
| Column | Meaning | Color |
|---|---|---|
| To Do | Not started yet | Blue |
| Doing | In progress | Amber |
| Done | Completed | Green |
Rich Task Cards
Each task card shows:
- Category badge: Work (purple), Marketing (amber), Development (green), Personal (cyan)
- Priority badge: Urgent (red), Normal (blue), Someday (gray)
- Track status: On Track (green), At Risk (amber), Off Track (red)
- Due date: When it needs to be done
Drag. Drop. Done.
// Native drag-and-drop, no libraries
card.addEventListener('dragstart', handleDragStart);
column.addEventListener('drop', handleDrop);
Drag a card from To Do to Doing, and it automatically:
- Updates status in Qdrant
- Dispatches to the coordinator agent (if not already assigned)
- Refreshes the board
Productivity Dashboard
At the top, a donut chart shows your task distribution:
- Instant visual of what’s done vs. what’s pending
- Motivational messages based on completion percentage
- “Outstanding — you crushed it! 🏆” at 90%+ done
Enhanced Agent Cards
The Agents tab got a glow-up—literally. Each agent now has distinct styling.
Glow Borders
.glow-kimi::after {
    background: linear-gradient(135deg, #6366f1, #8b5cf6);
}
.glow-sarah::after {
    background: linear-gradient(135deg, #10B981, #34D399);
}
Each agent has a gradient glow that matches their role:
- Main Agent (Personal Assistant): Purple-to-violet
- Research Specialist (Research): Emerald gradient
- Content Writer (Writing): Deep purple
- Visual Designer (Images): Cyan
- DevOps Specialist (Deployment): Magenta
- Software Developer (Coding): Amber
More Than Just Stats
Each card now shows:
- Model in use (glm-5:cloud or qwen3-coder-next:cloud)
- Tasks completed today
- Last active timestamp
- Most recent task with status badge
- Connection status indicator (pulsing green dot)
Model Usage Tracking
A new table breaks down model usage by agent:
| Agent | Model | Today | Total |
|---|---|---|---|
| Main Agent | glm-5:cloud | 12 | 347 |
| DevOps Specialist | qwen3-coder-next:cloud | 8 | 156 |
This matters when you’re tracking API costs. At a glance, you can see which agents are busiest and which models they’re using.
Design: Glassmorphism Done Right
The dashboard uses glassmorphism throughout:
.glass-card {
    background: rgba(31, 41, 55, 0.7);
    backdrop-filter: blur(20px);
    border: 1px solid rgba(55, 65, 81, 0.5);
}
Why this works:
- Depth without heaviness: The blur creates layers
- Consistency: Every card uses the same pattern
- Performance: CSS-only, no JavaScript effects
- Dark theme friendly: Works beautifully with the indigo/cyan accent colors
Still Zero Build
The most important thing? No new dependencies.
The dashboard remains a single HTML file:
- Tailwind CSS via CDN
- Chart.js via CDN
- Inter font via Google Fonts
- ~1100 lines of vanilla JavaScript
- Edit, refresh, done
No npm install. No webpack. No rebuild step. The moment you save the file, the changes are live.
The Numbers
| Metric | Value |
|---|---|
| File size | ~78KB unminified |
| Load time | ~300ms on local network |
| Dependencies | 3 CDN scripts |
| Qdrant collections | 3 (agent_logs, todos, drafts) |
| API endpoints | 4 proxy routes |
| Agents tracked | 7 |
What’s Next
A few ideas in the backlog:
- WebSocket updates: Real-time activity without manual refresh
- Agent chat: Send messages to agents from the dashboard
- Cost tracking: Per-agent token usage and estimated costs
- Export: Download logs as CSV/JSON
The dashboard has evolved from a simple activity feed into a real command center. The Content tab shows what’s being published. The Kanban board manages what needs to be done. The Agent cards show who’s working on what. And it all still runs on a single HTML file.
That’s the power of zero-build architecture: you can add features without adding complexity.
The AgentOS Dashboard is deployed internally with HTTP Basic Authentication at port 45680.

Comments
Powered by GitHub Discussions