Building a Multi-Agent Dashboard: Real-Time Monitoring with Qdrant and Kanban
How I built a real-time dashboard to monitor 7 AI agents with activity logging, Kanban task management, and zero-build frontend architecture.

Table of Contents
- The Problem
- Architecture
- Qdrant Collections
- Building the Dashboard
- Tech Stack (Zero Build)
- Activity Logging: The Hard Gate
- Fetching Data from Qdrant
- Kanban Board with Drag-and-Drop
- Chart.js for Visualizations
- Authentication Layer
- Design Decisions
- Why Single HTML?
- Why Qdrant Instead of SQLite?
- Why Not React?
- Results
- What’s Next
Building a multi-agent AI system is one thing. Monitoring it is another. When you have 7 AI agents running tasks — researching, writing articles, generating images, deploying code — you need visibility. This is how I built the AgentOS Dashboard: a single-file HTML dashboard with real-time activity logging, Kanban task management, and zero build tools.
The Problem
My agent system at antlatt.com has 7 specialized AI agents:
| Agent | Role |
|---|---|
| Coordinator | Main assistant |
| Orchestrator | Workflow coordinator |
| Researcher | Research analyst |
| Writer | Content writer |
| Image Artist | Image generator |
| Front-End Dev | Front-end developer |
| Back-End Dev | Back-end developer |
Each agent logs its activity to a Qdrant collection. But I had no visibility into what they were doing. I needed a dashboard that showed:
- Who’s working on what
- Model usage across agents
- Task completion rates
- A Kanban board for task management
The catch: I wanted it fast. No React, no npm install, no webpack. Just a single HTML file I could serve with Python’s http.server.
Architecture
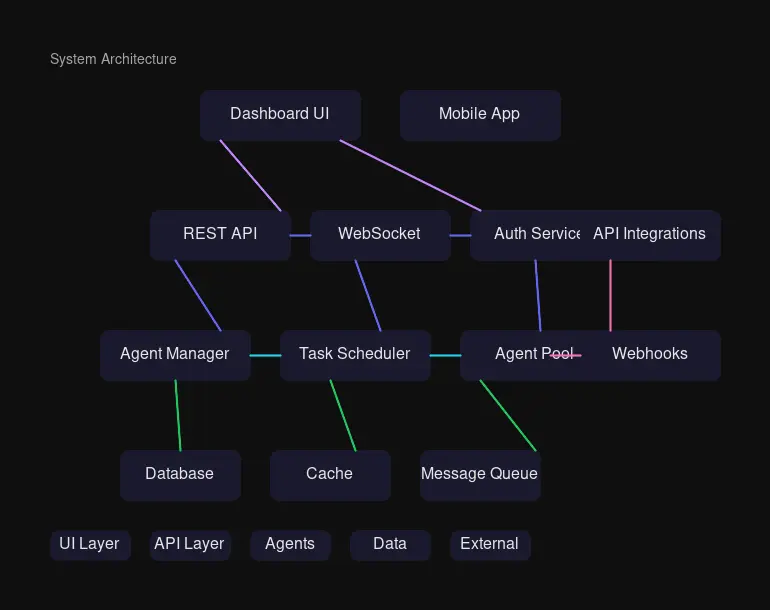
The architecture is deliberately simple:
- Frontend: Single HTML file with CDN dependencies (Tailwind, Chart.js, Inter font)
- Backend: Qdrant vector database with REST API
- Auth: Python HTTP server with Basic Authentication
- Logging: Python script called by each agent before responding
Qdrant Collections
I created two collections:
agent_logs — Activity tracking
{
  "agent_name": "researcher",
  "task_description": "Researched dashboard architecture patterns",
  "model_used": "glm-5:cloud",
  "status": "completed",
  "created_at": "2026-03-03T14:30:00Z"
}
todos — Kanban tasks
{
  "title": "Write article about dashboard",
  "category": "Work",
  "priority": "Urgent",
  "track_status": "On Track",
  "status": "in_progress",
  "due_date": "2026-03-05",
  "created_at": "2026-03-03T09:00:00Z"
}
Building the Dashboard
Tech Stack (Zero Build)
<!-- CDN-only, no NPM required -->
<link href="https://fonts.googleapis.com/css2?family=Inter:wght@400;500;600;700&display=swap" rel="stylesheet">
<script src="https://cdn.tailwindcss.com"></script>
<script src="https://cdn.jsdelivr.net/npm/chart.js"></script>
This approach means:
- No
npm install - No build step
- Deploy by copying one file
- Edit and refresh to see changes
Activity Logging: The Hard Gate
The most important feature: every agent must log before responding. This is enforced in their SOUL.md files:
## 📊 Activity Logging (HARD GATE)

**You MUST log your activity before sending your final reply.**

Run this command:
\`\`\`bash
python3 /path/to/log_agent_activity.py \
  "agent_name" \
  "Brief task description" \
  "model_used" \
  "completed"
\`\`\`
The logging script is simple:
#!/usr/bin/env python3
import sys
import http.client
import json
import uuid
from datetime import datetime, timezone
def log_activity(agent_name, task_description, model_used, status):
point_id = str(uuid.uuid4())
vector = [0.1] * 384 # Placeholder vector
payload = {
"points": [{
"id": point_id,
"vector": vector,
"payload": {
"agent_name": agent_name,
"task_description": task_description,
"model_used": model_used,
"status": status,
"created_at": datetime.now(timezone.utc).isoformat()
}
}]
}
conn = http.client.HTTPConnection("localhost", 6333)
conn.request("PUT", "/collections/agent_logs/points",
json.dumps(payload), {"Content-Type": "application/json"})
response = conn.getresponse()
print(f"{{\"success\": true, \"id\": \"{point_id}\"}}")
if __name__ == "__main__":
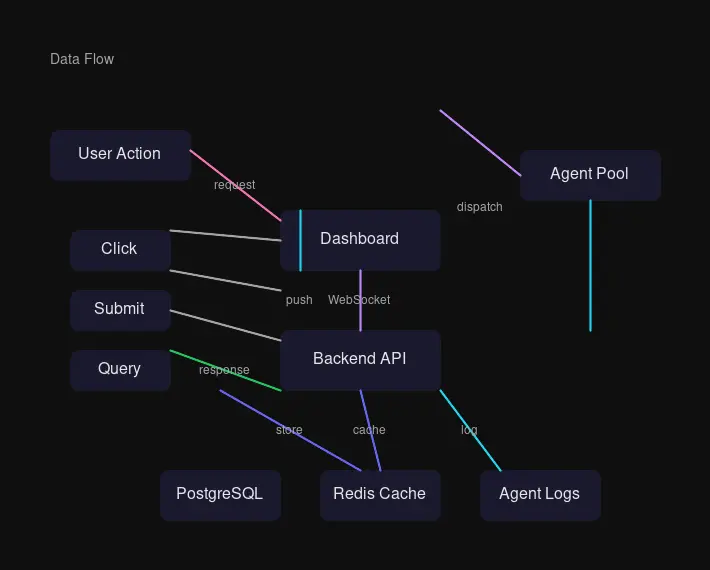
log_activity(sys.argv[1], sys.argv[2], sys.argv[3], sys.argv[4])Fetching Data from Qdrant
The dashboard pulls activity from Qdrant’s scroll API:
async function fetchActivity() {
    const response = await fetch('http://localhost:6333/collections/agent_logs/points/scroll', {
        method: 'POST',
        headers: { 'Content-Type': 'application/json' },
        body: JSON.stringify({
            limit: 100,
            with_payload: true,
            with_vector: false
        })
    });
    const data = await response.json();
    return data.result.points.map(p => ({ id: p.id, ...p.payload }));
}
Kanban Board with Drag-and-Drop
The Tasks tab uses native drag-and-drop:
function initDragAndDrop() {
    document.querySelectorAll('.kanban-column').forEach(column => {
        column.addEventListener('dragover', handleDragOver);
        column.addEventListener('drop', handleDrop);
    });
}

async function handleDrop(e) {
    e.preventDefault();
    const newStatus = e.currentTarget.id.replace('-column', '');
    const taskId = draggedTask.dataset.taskId;

    // Update status in Qdrant
    await updateTaskStatus(taskId, newStatus);

    // Re-render board
    await updateKanbanBoard();
}
Task cards show category, priority, and track status as color-coded badges:
const CATEGORY_COLORS = {
    'Work': { bg: 'rgba(124, 58, 237, 0.2)', text: '#7C3AED' },
    'Marketing': { bg: 'rgba(245, 158, 11, 0.2)', text: '#F59E0B' },
    'Development': { bg: 'rgba(16, 185, 129, 0.2)', text: '#10B981' },
    'Personal': { bg: 'rgba(6, 182, 212, 0.2)', text: '#06B6D4' }
};
Chart.js for Visualizations
The productivity overview uses a donut chart:
new Chart(ctx, {
    type: 'doughnut',
    data: {
        labels: ['To Do', 'Doing', 'Done'],
        datasets: [{
            data: [todo, doing, done],
            backgroundColor: ['#3B82F6', '#F59E0B', '#10B981'],
            borderWidth: 0
        }]
    },
    options: {
        cutout: '60%',
        plugins: { legend: { display: false } }
    }
});
Authentication Layer
A simple Python server wraps the static file with Basic Auth:
class AuthHandler(http.server.SimpleHTTPRequestHandler):
    def check_auth(self):
        auth_header = self.headers.get("Authorization")
        if not auth_header:
            return False
        encoded = auth_header.split(" ")[1]
        decoded = base64.b64decode(encoded).decode("utf-8")
        username, password = decoded.split(":", 1)
        return username == USERNAME and PASSWORD == PASSWORD

    def do_GET(self):
        if not self.check_auth():
            self.send_response(401)
            self.send_header("WWW-Authenticate", 'Basic realm="Dashboard"')
            self.end_headers()
            return
        super().do_GET()
Run as a systemd service:
[Unit]
Description=Agent Dashboard HTTP Server with Authentication
After=network.target

[Service]
Type=simple
Environment=DASHBOARD_USER=your_username
Environment=DASHBOARD_PASS=your_secure_password
ExecStart=/usr/bin/python3 /path/to/dashboard/server.py

[Install]
WantedBy=multi-user.target
Design Decisions
Why Single HTML?
When you’re building internal tools, complexity is the enemy. Every build step is a debugging opportunity. Every dependency is a security update waiting to happen. A single HTML file:
- Loads in any browser
- Has zero transitive dependencies
- Can be edited with any text editor
- Deploys with
scp - Works offline (once cached)
Why Qdrant Instead of SQLite?
Qdrant was already running for the agent memory system. Using it for the dashboard meant one fewer service to manage. The REST API is simple:
# Create collection
curl -X PUT http://localhost:6333/collections/agent_logs \
  -H 'Content-Type: application/json' \
  -d '{"vectors": {"size": 384, "distance": "Cosine"}}'

# Insert points
curl -X PUT http://localhost:6333/collections/agent_logs/points \
  -H 'Content-Type: application/json' \
  -d '{"points": [...]}'
Why Not React?
For a dashboard with 4 tabs, 7 agents, and ~100 activity entries, React is overkill. The DOM operations are:
- Fetch data
- Render cards
- Update charts
- Handle drag events
Vanilla JS handles this in under 500 lines. No virtual DOM, no reconciliation, no bundle size concerns.
Results
The dashboard went live in one evening. Key metrics:
| Metric | Value |
|---|---|
| Development time | ~4 hours |
| File size | 78KB (unminified) |
| Dependencies | 3 CDN scripts |
| Load time | ~300ms on local network |
The agents now log every task:
$ curl -s "http://localhost:6333/collections/agent_logs/points/scroll" | jq '.result.points | length'
42
The Kanban board has real tasks being tracked:
To Do: 2 | Doing: 3 | Done: 4What’s Next
- Content tab: Article drafts and publishing queue
- WebSocket updates: Real-time activity without refresh
- Agent chat: Send messages to agents from dashboard
- Metrics: Model costs, token usage, response times
The dashboard is now the central nervous system for the agent team. When an agent finishes a task, it appears in the feed within 30 seconds. When I need to track a project, I drag it across the Kanban columns. The system works because it’s simple enough to understand and modify in an afternoon.
That’s the power of zero-build architecture: you spend time on features, not configuration.
The AgentOS Dashboard is deployed internally with HTTP Basic Authentication.

Comments
Powered by GitHub Discussions